
All Sorts of Arizonans Love ESAs
All Sorts of Arizonans Love ESAs
At Least Daniel Rosenblatt's Data Doesn't Show Otherwise

Last Monday, Dillon Rosenblatt shared his short blog article about data he had requested from the AZ Department of Education on the ZIP Codes from those applying for ESAs after HB 2853 was signed. He somehow seems to have concluded that the data show that “wealthy Arizonans love ESAs” by which I think he means that ESAs are a scheme by the rich to save some money.
Before diving into his data I should say, Dillon Rosenblatt’s blog is pretty cool. I am, as I assume most people are, appreciative of those who make public records requests and then share any nuggets they find. That said, Dillon’s article on ESAs, particularly the title, misrepresented this particular nugget.
Rosenblatt’s Data
Back to his article, Dillon wants to find out about the relationship between wealth and applying for an ESA. To do this he added the American Community Service (ACS) estimates of median household income to each ZIP Code1. Then he sorted the data by the number of ESA applications in each ZIP Code and looked at how high the median household incomes are compared to the state median
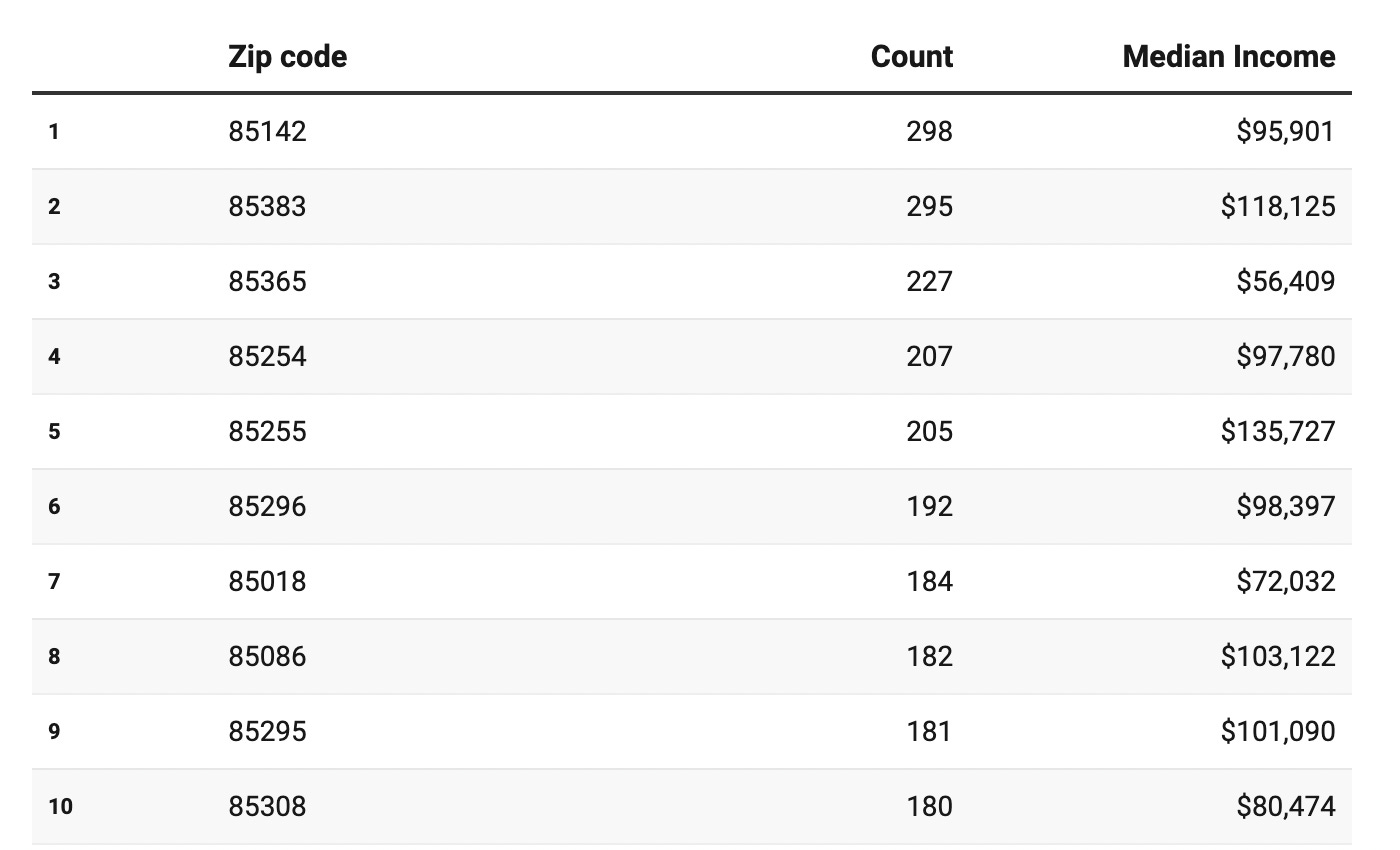
Ok, what is that supposed to show us? He points out that the median household income numbers for a lot of these ZIP Codes near the top are higher than the state median, but we cannot jump from this to any sort of claim about ESAs being predominantly used by the wealthy.
Also, because it’s easier to read all the data at once through a chart, I’ve provided one.

Missing Data
To make meaningful claims about the wealth of ESA applicants (without even trying to say the effect of wealth on the propensity to apply for an ESA), we want to know the wealth of the people applying for ESAs, but these data are missing, as in no one has these data whether or not they make a public records request.
The science of statistics offers tools to help fill in or estimate this missing data; however, just taking the median income for each ZIP Code, as Rosenblatt does, is probably not a good way to estimate this. Why?
For starters, the median household income of a family that has children enrolled in K-12 schools is going to be higher than the state median household income. Using ACS data, I determined it’s between $75k and $100k while the state median is reported as $62k. (I can make a more precise estimate if a reader really wants to see it, but for this post I thought it wasn’t worth the extra time.) Perhaps Dillon could have just as well have written an article entitled “Wealthy Arizonans love schools” or “Wealthy Arizonans love education,” maybe even “Wealthy Arizonans love children.” (Yes, I realize that many Arizonans wish they could afford more children. ESAs, which can be used for college and extracurriculars, can help with that.)
Confounders and Causality
Even using the median household income of enrolled students will not be sufficient to make claims about wealth leading to increased ESA use. There are a number of what statisticians call “confounding variables” that complicate things and must be taken into account. A confounding variable is, in this case, some thing that influences both the number of ESA applicants and the median household income in a ZIP Code.
One clear confounding variable, that Rosenblatt almost mentions with a remark on Colorado City, is religion. Religion is closely tied to childhood education decisions and is also, probably more indirectly, tied to household income. For a variety of reasons, certain faiths end up rather poor and others relatively rich. Faiths also influence what sort of an education the family chooses for their children. Jews may go to yeshivot and Catholics to their local parish school, so both groups may be more likely to end up applying for ESAs.
Correcting for ZIP Code Demographics
Along with using a poor estimate for applicants’ incomes and neglecting confounders, Rosenblatt is using the raw number of ESA applications for each ZIP Code. Some ZIP codes have a lot more children enrolled in school than others; if ESA applications were evenly distributed across households in AZ, then Rosenblatt’s original ordered chart would just show us a list of ZIP Codes ordered by the size of the student population. If we divide the number of ESA applications by the number of students enrolled in school (including homeschool) for each ZIP Code, we get the analogous chart and plot below.


Conclusion
Hopefully people do keep looking at the data surrounding the new ESA law, but do keep in mind that we aren’t going to know empirically what the outcome of universal ESAs will be until after several years. The first people to jump to ESAs are going to be the people for whom it is easiest, those who already have kids in private schools (which includes homeschools). As time goes on however, more people will be in a good place to deliberately choose the best school for their kid, and more kindergarteners may simply start their school lives in private school. Demographics of who applies for ESAs will shift.
Also, as Dillon points out in an astute footnote, with the increased competition between private and public options,
Something to keep an eye on is how many schools will lower their tuition to $7,000 or new schools that will open up around this amount for the purpose of siphoning students from the competition.
Things are changing in the AZ education marketplace. We are in something of a market transition now that state funding is coupled to students.
If you want any data or code, or if you have any comments, let me know. I’ll eventually be putting stuff up on GitHub, and I’ll update this post with a link when that happens.
Actually, the Census Bureau uses ZIP Code Tract Areas (ZCTAs) instead of ZIP Codes which are slightly different. You can read more at https://www.unitedstateszipcodes.org/, but the gist of the matter is that ZIP Codes are made for the convenience of USPS mail delivery so their boundaries often end up splitting up a block in order to not split down the middle of a street.